Buyers and sellers compete for control of price on every bar. TPX uses the change in each bar’s high and low, measured against a recent price range, as a proxy for the pressure each side is exerting, and translates that contest into a clear, bounded pressure oscillator.
TPX plots bull pressure, bear pressure and the net of the two on a 0–100 scale. A side is dominant when its pressure is at or above the Control Level and higher than the other side. TPX is closest in spirit to the concept behind the classic DMI/ADX: directional pressure and dominance.
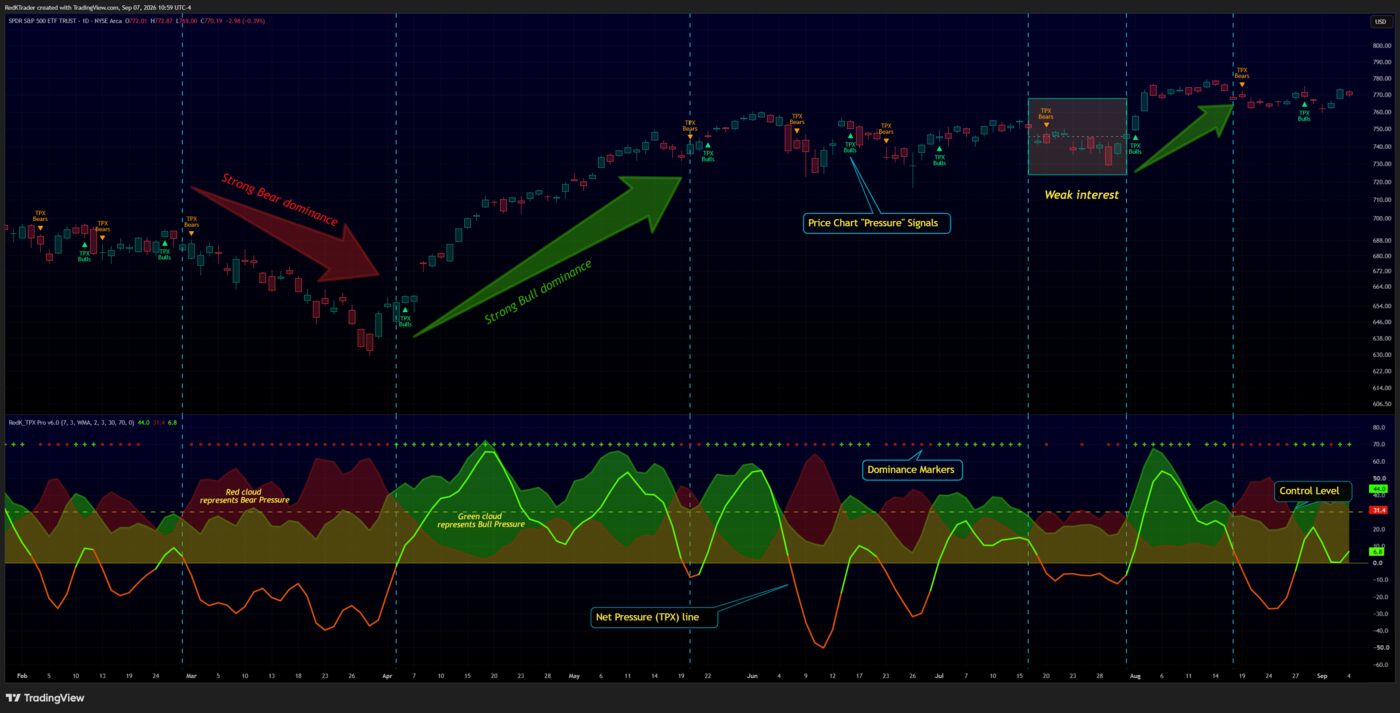
Full details, settings and examples are in the release notes on TradingView: RedK TPX (free) · TPX Pro.