VADER starts from a simple idea that combines price action and volume: a price move (the displacement) together with the volume behind it (the effort) gives a proxy of the energy behind that move. Buying energy when price moves up, selling energy when price moves down.
VADER measures Demand Energy and Supply Energy separately, and plots the net energy between -100 and +100. Above zero, the buyers have the energy. Below zero, the sellers do.
VADER does not track price levels or trend directly, so it works best as a secondary indicator, together with trend and momentum indicators. The free RedK VADER, released in 2022, is an Editors’ Pick on TradingView.
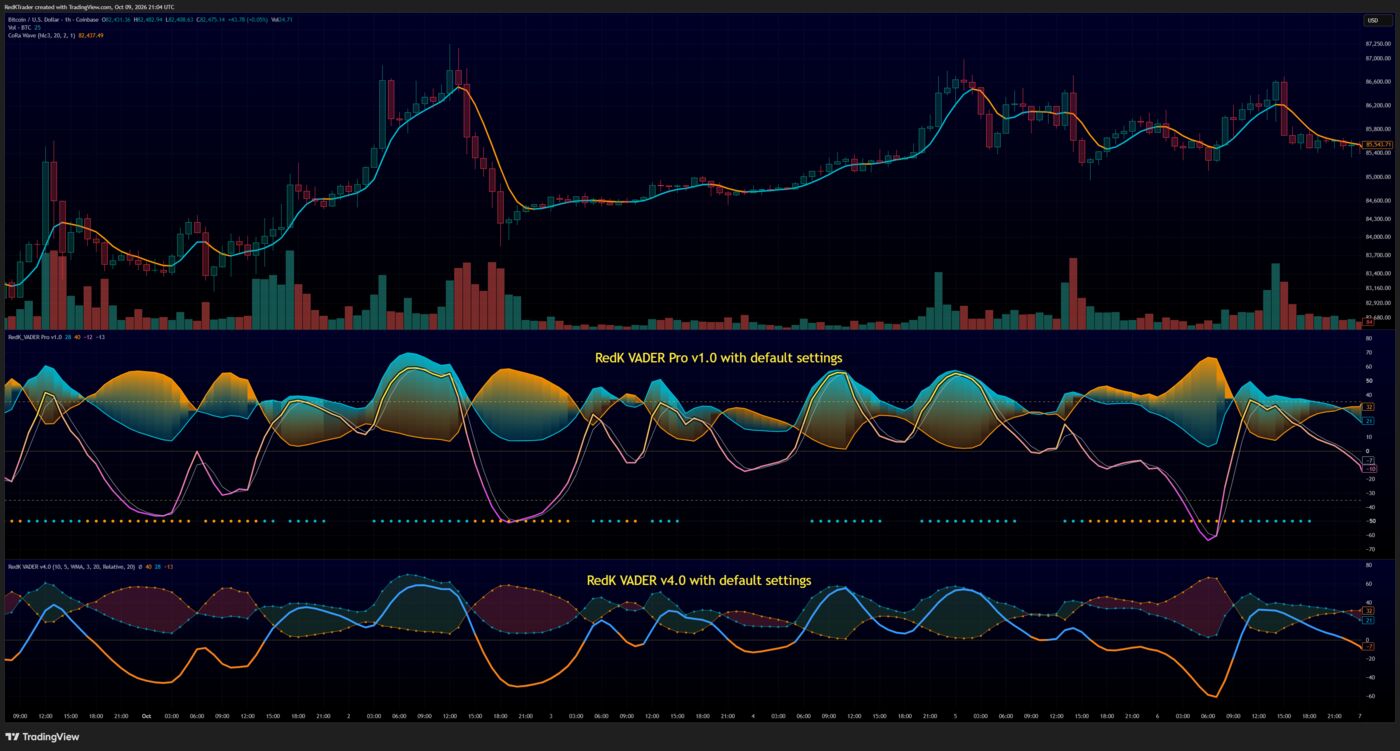
Full details, settings and examples are in the release notes on TradingView: RedK VADER (free) · VADER Pro.