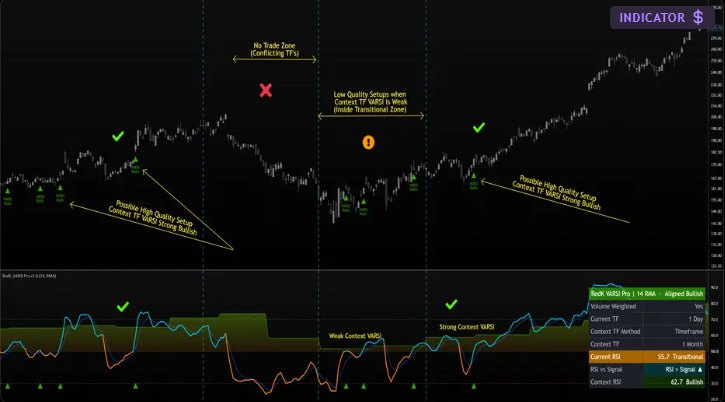
VARSI imposes volume impact on the widely used RSI (Relative Strength Index), for improved combined price action and volume analysis, and shows the result from two timeframes at once: the current chart timeframe, and a higher Context timeframe of your choice.
VARSI reads like a standard RSI, with the 0–100 scale and the 50 midline. When the current and the Context VARSI agree in direction from the midline, the two timeframes are aligned, and the Alignment Markers show these moments.
Full details, settings and examples are in the release notes on TradingView: RedK VARSI (free) · VARSI Pro.